


 Your new post is loading...

Understanding histograms has two purposes: to learn another tool that comes with your camera and maybe, more importantly, to train your digital photographer’s eye to “read” the images you’re about to shoot in a way different than just looking at them through your viewfinder. Typically, “histogram” is a selection on the menu of your camera system.
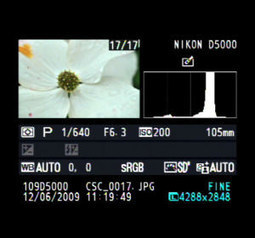
You’ll see the image you want to photograph, with date, time, exposure settings and other information. Next to the image is the histogram graph.
It shows you the black to gray to white tones of your picture in a vertical range.
The technology recognizes the tonal levels of areas within the image, according to the number of pixels for each black, gray or white tone.
The high points on a histogram represent the tones with the greatest number of pixels.
When there are more high points to the left of the histogram, your digital image has many dark tones. More high points to the right represents an image with many lighter tones.


Sometime in your knowledge of digital photography, we all have to learn the HIstogram. Which to me looks like something a hospital would have, until I sat down and learned that it shows you the tones, that if your picture is darker the graph with have more points towards the left. And the right would represent an image with lighter tones. This helps if you are a photography student of if you generally are teaching yourself the structure and basics of yoru DSLR.